Overview of the real estate portfolio as at 31 December 2022:
| Region | Space in m² | Annual rent(a) | Investment value(a) | Fair value(a) | (%) |
| Brussels | 8.848 | 2.908 | 60.097 | 58.631 | 19% |
| Flemish Region | 56.359 | 13.824 | 231.390 | 225.748 | 72% |
| Walloon Region | 10.879 | 2.179 | 28.915 | 28.211 | 9% |
| Total investment properties | 76.086 | 18.911 | 320.402 | 312.590 | 100% |
(a) € thousands
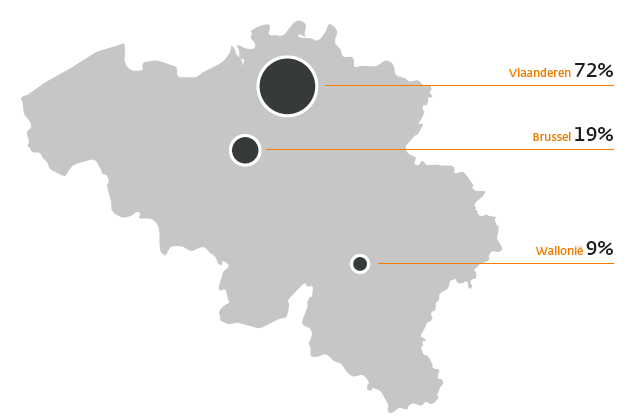
Geographic spread of the properties
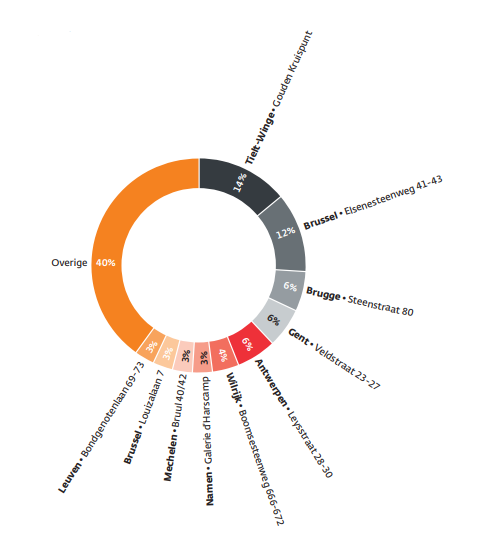
Risk spread according to buildings based on fair value
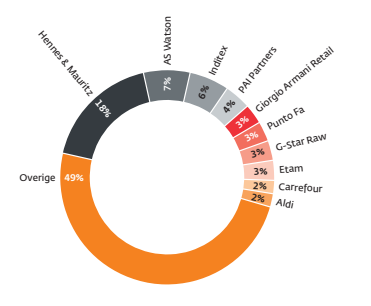
Risk spread according to tenants based on rental income